Connected Apps
⚙️ Report Format
These metrics will be synced daily from each connected data source into each connected data destination.
Either Date or Month must be selected as a report dimension.
The date associated with each metric.
segments.date
Bing
date_start
TimePeriod
The month associated with each metric.
segments.month
Bing
TimePeriod
date_start
The campaign id associated with each metric.
campaign.id
Bing
CampaignId
campaign_id
The name of your campaign.
campaign.name
Bing
CampaignName
campaign_name
The number of times your ad was shown.
impressions
Bing
Impressions
impressions
The number of times your ad was clicked.
clicks
Bing
Clicks
action => action_type = link_click
Click Through Rate (CTR) is the ratio of clicks to impressions.
ctr
Bing
Ctr
ctr
Average Cost Per Click (CPC) is the average amount you pay for each click.
averageCpc / 1000000
Bing
AverageCpc
cpc
The amount you spent on advertising.
costmicros / 1000000
Bing
Spend
cost
The number of conversions.
allConversions
Bing
Conversions
action_values => action_type = purchase
Conversion Rate is the ratio of conversions to clicks.
allConversionsFromInteractionsRate
Bing
Conversions / Clicks
actions => (action_values => action_type === 'purchase') / (actions => action_type === 'link_click')
Cost Per Conversion is the average amount you pay for each conversion.
costPerConversion / 1000000
Bing
CostPerConversion
spend / ( action_values => action_type === purchase )
The amount of revenue generated.
allConversionsValue
Bing
Revenue
action_values => action_type === 'purchase'
Return on Ad Spend (ROAS) is a measures the revenue generated for every dollar spent on advertising.
allconversionsvalue / (costmicros / 1000)
Bing
revenue / spend
revenue / cost
🔌 Data Sources
Google Ads
Your Google Ads Customer ID is a 10-digit number that uniquely identifies your Google Ads account. You can find your Customer ID at the top right corner of your Google Ads account.

Google Ads requires an MCC for an external connection. This will connect all of the associated accounts under the MCC. If you don't have an MCC, you can create one in your Google Ads account.
Name and save the Customer Account IDs you want synced. Records from this source will have a "source" parameter equal to the name.
Connect your Google Ads account
Facebook Ads
Instructions
Your Ad Account ID can be found in several different places on your Ads Manager dashboard

Use the Tool
Connect to Facebook
Connecting utilizes a Facebook long-lived access token to access your Facebook Ads data. This token lasts about 60 days, after which you will receive a notification email to reconnect.
Bing

Use the Tool
Mongo DB (experimental)
contact [email protected] to enable
🌐 Data Destinations
BigQuery
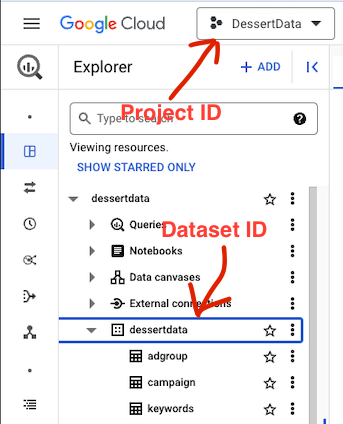
Your Google Cloud Project ID, and BigQuery Dataset ID can be found in your Google Cloud Console.

BigQuery connections will populate a new dessertdata dataset with several tables depending on which data sources are connected.
Table Details
default_[source]
The "default" tables power the unified_report view. This is the source data from each connected data source. These tables power the data in the unified_report view, and are not intended to be queried directly.
unified_report
This view contains selected report metrics for each connected data source.
GoogleSheets
After the initial sync, you can open the spreadsheet to view and edit the data.
(Not yet connected) Dessert Data
